
An SEO report should tell you more than whether a few numbers went up or down. It should explain how people find your website through search, what they do after arriving, which parts of your SEO strategy are working, what problems are limiting performance, and what should happen next. The difficult part for beginners is that SEO reports often combine information from several platforms. You may see Google Search Console clicks, Google Analytics sessions, keyword rankings, backlinks, conversions, indexed pages, and technical scores in the same document. You do not need to become an SEO expert to understand them. You just need to read the information in the right order.
What an SEO Report Actually Tells You
An SEO report summarises how a website is performing in unpaid search results. It may combine information about:
- Search visibility
- Website visitors from organic search
- Leads, sales, sign-ups, or other important actions
- Keyword rankings
- Landing-page performance
- Indexing and technical problems
- Website speed and user experience
- Backlinks
- SEO work completed
- Recommended priorities
A good report does not simply display data. It explains what changed, why the change matters, and what action should follow.
SEO Report vs SEO Audit
These terms are sometimes used as though they mean the same thing, but they usually serve different purposes.
An SEO report tracks performance over a period, such as a month or quarter. It shows whether visibility, traffic, conversions, or rankings improved.
A comprehensive SEO audit is a deeper examination of a website’s current condition. It identifies technical, content, on-page, structural, or backlink problems that may be limiting performance.
A monthly report might show that organic clicks declined. An audit may help uncover the reason, such as accidental noindex tags, duplicate content, broken internal links, or poor page performance.
Check These Four Things Before Reading the Numbers
Before deciding whether any metric is good or bad, establish the context.
| Check | What to look for | Why it matters |
|---|---|---|
| Reporting period | Exact start and end dates | A full month should not be compared with a partial month |
| Comparison period | Previous month, previous quarter, or previous year | Different comparisons answer different questions |
| Data source | Search Console, GA4, rank tracker, crawler, or link tool | Each platform measures something different |
| Business objective | Leads, sales, subscriptions, calls, bookings, or visibility | The report should be judged against the real goal |
Look at the Reporting Period
A report covering July 1 to July 31 should be compared with a similarly complete period. Comparing 31 days with 20 days can create a false decline. Month-over-month comparisons are useful for spotting recent movement. Year-over-year comparisons are often better for seasonal businesses because they compare similar times of year.
For example, a tax website may naturally receive less traffic after the filing deadline. A travel site may experience predictable seasonal changes. A decline is not automatically an SEO failure when search demand has also fallen.
Identify the Data Source
The name of the platform should appear beside each metric. Google Search Console measures how a website appears in Google Search. Its Performance report includes clicks, impressions, CTR, and average position. Google Analytics 4 measures website and app activity after users arrive. Its Traffic acquisition report helps show where sessions originated, including Organic Search.
A third-party rank tracker estimates or records rankings for selected keywords. A backlink platform maintains its own link database. A crawling tool checks accessible website pages for technical conditions. These tools may all be useful, but their numbers should not be treated as interchangeable.
Confirm the business objective
The report should reflect what the website is supposed to achieve.
For an ecommerce store, the main outcome may be purchases and revenue. For a law firm, it may be calls and consultation requests. For a publisher, it may be readership, subscriptions, or advertising income.
If the report celebrates ranking improvements without showing whether those rankings attract the right visitors, it is incomplete.
Read the SEO Report in This Order

The easiest way to understand a report is to begin with business results and work backwards to the factors that may have influenced them.
1. Start with Conversions and Business Results
Look for the actions that matter most to the website, such as:
- Purchases
- Contact-form submissions
- Phone calls
- Appointment bookings
- Trial registrations
- Newsletter sign-ups
- Downloads
- Revenue from organic traffic
Google Analytics uses key events to identify actions that are particularly important to a business. These events can be included in acquisition and landing-page reports.
Ask:
- Did organic conversions rise or fall?
- Did revenue or lead quality change?
- Which landing pages generated the results?
- Is conversion tracking configured correctly?
- Did the conversion rate change, or did only traffic change?
A traffic increase is encouraging, but a traffic increase with fewer conversions may indicate that the website is attracting less relevant visitors or that something in the conversion process is not working.
2. Review Organic Traffic
Organic traffic represents visits attributed to unpaid search results.
In GA4, check metrics such as:
- Organic sessions
- Organic users
- Engaged sessions
- Engagement rate
- Landing pages
- Key events
- Revenue, where applicable
Do not read the total traffic number alone. Find out which pages gained or lost visitors.
A 20 percent site-wide increase might come from one blog post that became temporarily popular. That may be valuable, but it is different from steady growth across important service or product pages.
Also check whether the traffic comes from relevant locations and devices. A local company may gain visitors from countries it cannot serve, increasing traffic without improving business results.
3. Examine search visibility
Google Search Console normally provides four central performance metrics.
| Metric | Plain-English meaning | Positive sign | Important caution |
|---|---|---|---|
| Impressions | How often a result from the site appeared in Google Search | Relevant pages are appearing more frequently | More impressions do not guarantee more visitors |
| Clicks | How often searchers clicked a result | More people are reaching the website from Google | A click is not automatically a lead or sale |
| CTR | Clicks divided by impressions | Listings are attracting a larger share of available clicks | CTR varies by query, position, device, intent, and search-result layout |
| Average position | Average position of the top result from the site across recorded impressions | Important pages or queries may be moving upward | A site-wide average can hide major differences between queries and pages |
Google defines CTR as clicks divided by impressions. Average position represents an average based on the topmost result from the property, and the value may vary by query, location, device, time, and search context.
Impressions
Rising impressions generally mean that Google is displaying the site more often. This can happen because:
- Existing rankings improved
- New pages began ranking
- Pages started appearing for more queries
- Search demand increased
- The site appeared in additional search features
The increase is most valuable when it occurs for relevant, non-branded searches that can attract the intended audience.
Clicks
Clicks show how many visits Google Search sent to the website according to Search Console’s counting method.
Look at:
- Total click trend
- Clicks by landing page
- Clicks by query
- Branded versus non-branded clicks
- Mobile versus desktop clicks
- Country or regional changes
A site can lose clicks even while maintaining similar rankings if search demand declines or the search-results page changes.
Click-through rate
CTR shows the percentage of impressions that resulted in a click.
For example, 500 clicks from 10,000 impressions produce a 5 percent CTR:
500 ÷ 10,000 × 100 = 5%
A falling CTR does not always mean that the title or description is poor. It may also happen because:
- The page appears for more broad queries
- Rankings changed
- Ads or other search features became more prominent
- An AI answer satisfied part of the search need
- Competitors created more appealing listings
- The query does not closely match the page
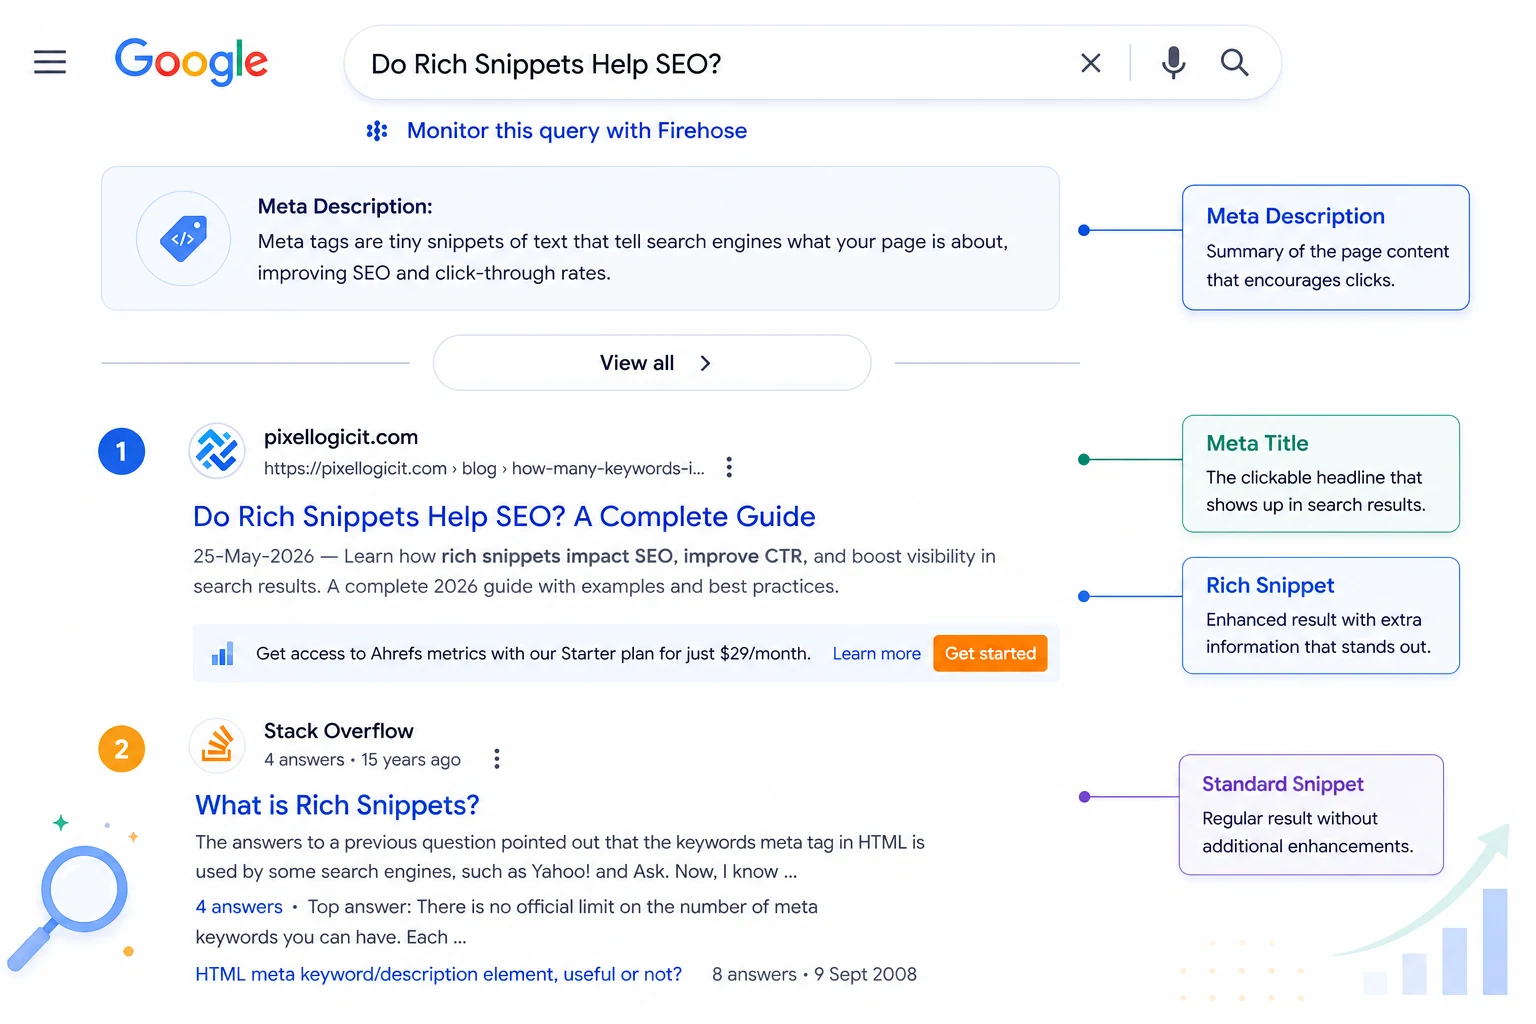
Investigate CTR by individual page and query before changing titles across the entire website. Use a meta tag preview to review how a revised title and description may appear before publishing it.
Average position
Average position is useful as a trend indicator, but it is one of the easiest SEO metrics to misread.
A site might rank in position 2 for one query and position 40 for another. Combining those results creates an average that represents neither search accurately.
Google recommends paying more attention to trends in clicks and impressions than to position alone.
Instead of asking, “What is our overall average position?” ask:
- Which commercially important queries improved?
- Which pages moved onto or off the first results page?
- Did rankings improve for relevant non-branded terms?
- Did ranking gains produce additional clicks or conversions?
4. Review Pages and Search Queries
The website-wide chart tells you what happened. Page and query data help explain where it happened.
Look for:
- Top gaining pages
- Top declining pages
- Queries gaining impressions
- Queries losing clicks
- Pages with high impressions but weak CTR
- Pages ranking just outside the strongest positions
- Multiple pages appearing for the same query
- Important pages receiving no search visibility
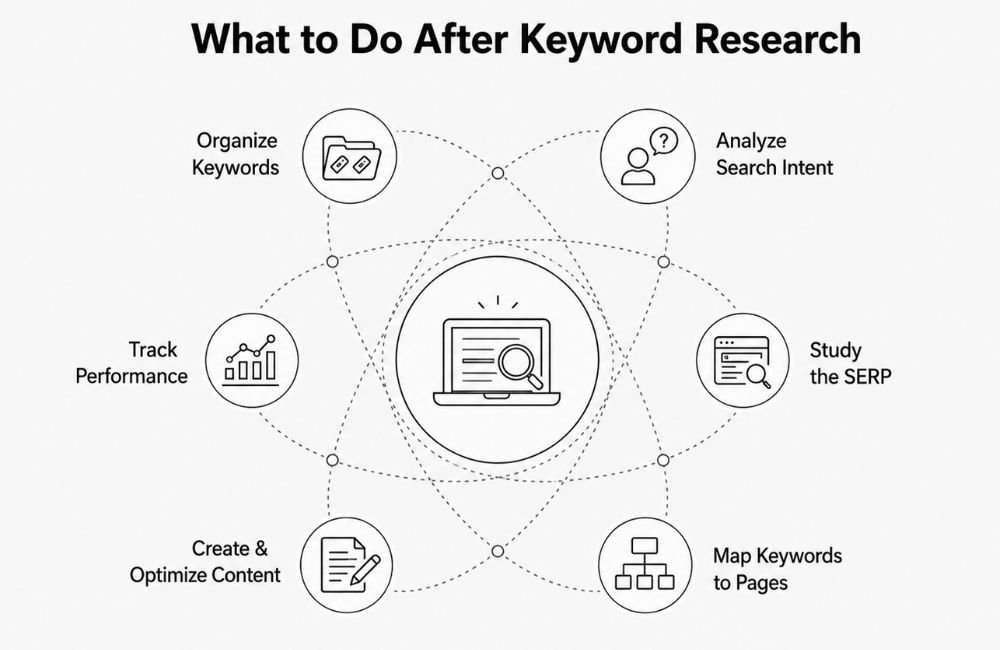
Google Search Console allows performance information to be grouped and filtered by page, query, device, country, search appearance, and date. A page with rising impressions and an average position around 11 to 15 may represent an optimisation opportunity. If the query is relevant, the next step is to turn keyword research into page improvements instead of reacting only to the site-wide average.
5. Check Technical SEO Health
Technical SEO data helps reveal whether search engines can access, understand, index, and present website content correctly.
Focus first on issues that affect important pages.
Indexing
Search Console’s Page indexing report shows indexed and non-indexed URLs known to Google, along with reasons some URLs were not indexed.
Do not assume that every non-indexed URL is a problem. Some pages should not appear in search results, including:
- Duplicate URLs
- Filter or parameter pages
- Private account areas
- Checkout pages
- Internal search results
- Redirected pages
- Intentionally excluded low-value pages
The important question is whether valuable pages that should attract search visitors are indexed.
A report should identify affected priority pages rather than simply presenting a large “not indexed” number.
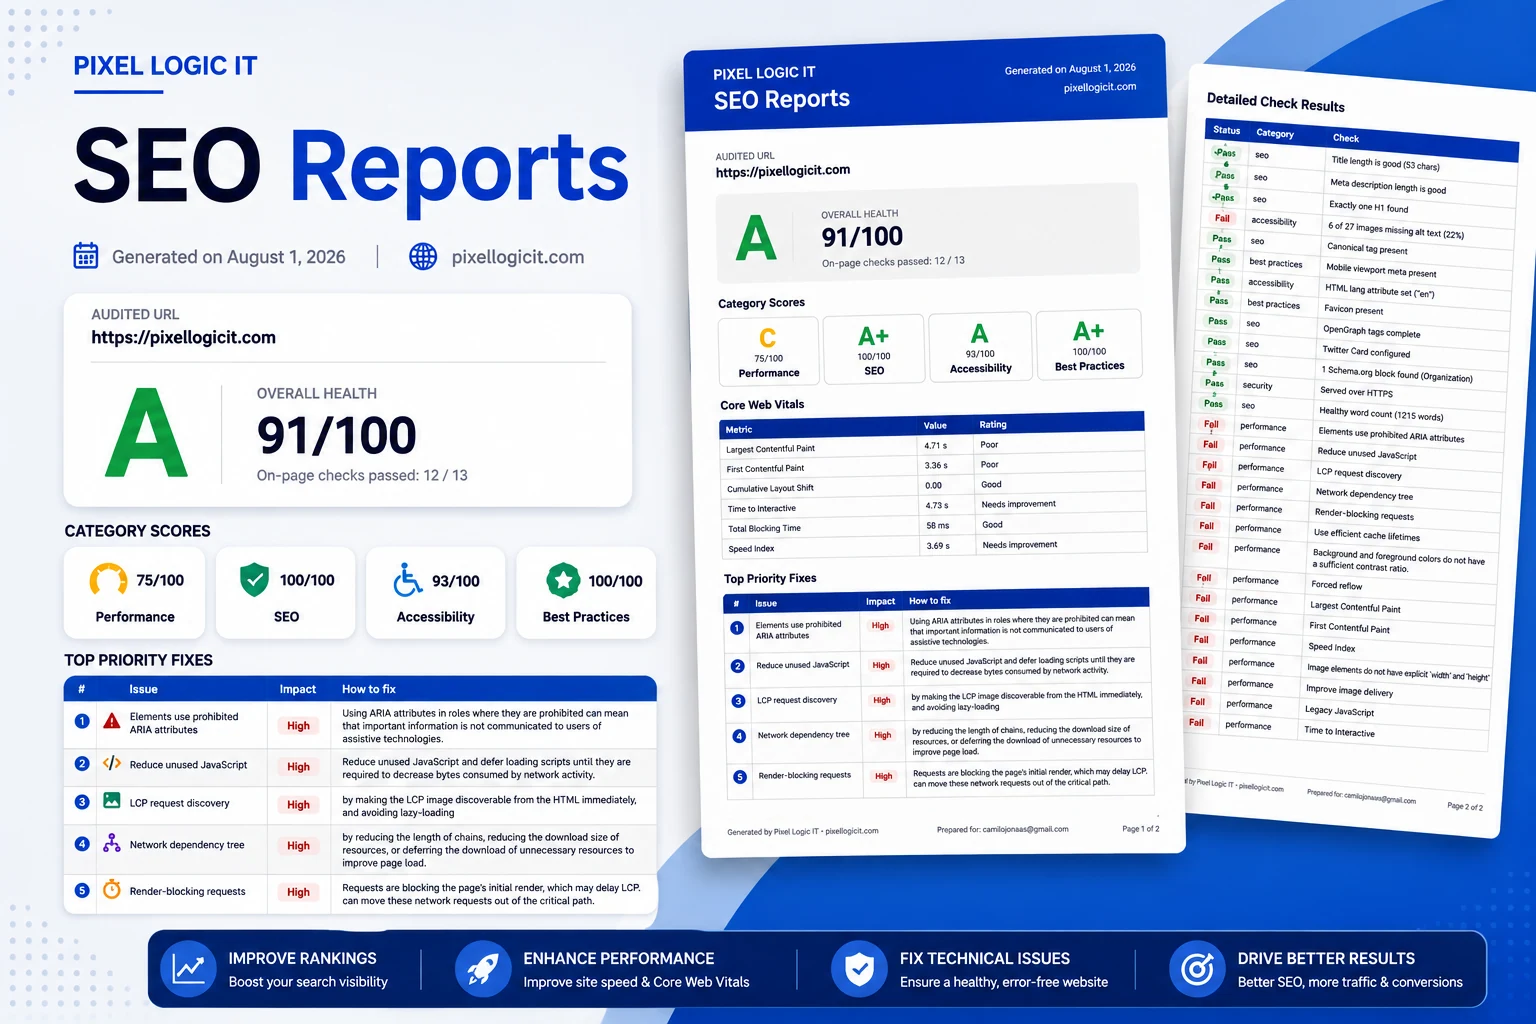
Core Web Vitals
The Core Web Vitals report groups URLs according to real-world user data and evaluates:
- Largest Contentful Paint: loading performance
- Interaction to Next Paint: responsiveness to user interaction
- Cumulative Layout Shift: visual stability
Search Console categorises URL groups as Good, Needs improvement, or Poor.
Poor performance deserves investigation, especially on high-value templates or landing pages. However, improving a technical score should support a better user experience, not become a substitute for relevant content and a clear conversion path.
Other technical issues
Depending on the report, you may also see:
- Broken pages
- Server errors
- Redirect problems
- Canonicalisation issues
- Duplicate title tags
- Missing headings
- Structured-data errors
- Sitemap issues
- Broken internal links
- Security or manual-action warnings
The report should separate critical problems from minor recommendations.
6. Review Backlinks and Referring Domains
Backlinks are links from other websites to yours. A well-planned off-page SEO strategy focuses on earning them from relevant, trustworthy sources that can help people discover your content and support search visibility.
Review:
- New referring domains
- Lost referring domains
- Pages receiving links
- Relevance of linking websites
- Link placement and context
- Unusual or spam-like link patterns
- Links to broken or redirected pages
Google Search Console’s Links report shows examples of external links, top linking sites, top linked pages, and common linking text. Google also explains that the report is a sample rather than a complete list of every link.
Do not judge this section by backlink count alone. Ten relevant editorial links may be more meaningful than hundreds of automatically generated links from unrelated sites. Third-party “authority” or “reputation” scores may be useful for comparison inside a particular tool, but they are not Google metrics and do not correspond directly to Google’s internal signals.
7. Find Completed Work and Next Actions
A useful monthly report should show both:
- What the SEO team completed
- What effect the work appears to have had
Completed activity might include:
- Publishing content
- Updating pages
- Fixing indexing problems
- Improving internal links
- Earning or recovering backlinks
- Correcting structured data
- Improving page performance
Activity is not the same as an outcome. Publishing ten articles proves that work was completed, but it does not prove that the work attracted qualified traffic or conversions.
The report should connect important actions with expected or observed results and then list the priorities for the next reporting period.
How to connect the numbers
SEO metrics become more useful when you read them together.
| Pattern in the report | Possible explanation | What to investigate |
|---|---|---|
| Impressions rise, but clicks remain flat | The site appears more often but is not earning a proportional number of clicks | Query relevance, ranking position, titles, snippets, devices, and search features |
| Clicks rise, but GA4 organic sessions stay flat | The platforms use different measurement methods, or tracking may be incomplete | Date range, GA4 installation, consent settings, attribution, and landing-page data |
| Organic traffic rises, but conversions fall | New visitors may have weaker intent, or the conversion process may have problems | Landing pages, query intent, forms, checkout, calls, and key-event tracking |
| Rankings rise, but clicks decline | Search demand may have fallen, or rankings may have improved for low-volume terms | Query-level impressions, seasonality, and keyword relevance |
| CTR rises while impressions fall | The remaining visibility may come from stronger positions or more relevant queries | Lost queries, declining pages, and search demand |
| Indexed pages and clicks both fall | Important URLs may have been removed, blocked, redirected, or deindexed | Page indexing report, URL Inspection, site changes, robots directives, and canonical tags |
| Backlinks rise without measurable growth | The links may be weak, irrelevant, recent, or pointing to unimportant pages | Referring-domain quality, target URLs, link context, and longer-term trends |
These are starting points, not automatic diagnoses. One pattern can have several causes.
Why Search Console and GA4 Numbers Do Not Match

Beginners often assume that Search Console clicks and GA4 organic sessions should be identical. They measure different parts of the journey.
Search Console measures interactions with Google Search results. GA4 measures activity after the website or app loads and its tracking code runs.
Differences can arise from:
- JavaScript or analytics tracking not loading
- Consent choices
- Different time zones
- Different attribution rules
- Privacy processing
- Bot and duplicate filtering
- One user creating multiple sessions
- A click failing to load the page
- Different reporting delays
- Search Console query anonymisation
Google states that Search Console and Analytics data may differ because the tools cover and process information differently. Search Console reporting can also involve a delay, privacy filtering, and Pacific Time date labelling.
Small differences are normal. Large or sudden differences should be investigated.
How to Compare Reporting Periods Correctly
Use more than one comparison when possible.
Month over month
This shows recent movement. It is useful for detecting immediate changes after content updates, technical work, campaigns, or website problems.
Year over year
This reduces the effect of seasonality by comparing the same period in different years.
Trend over several months
A three-to-six-month view helps prevent overreacting to one unusual week or month.
Google notes that traffic can have seasonal and weekly fluctuations, so a drop should be investigated in context rather than treated automatically as a search penalty.
Add annotations for important events, including:
- Website redesigns
- Migrations
- Tracking changes
- Product launches
- Major content publication
- Technical outages
- Seasonal campaigns
- Search algorithm updates
How Generative AI Visibility Fits into an SEO Report

As of June 2026, Google Search Console provides dedicated Search Generative AI performance reports for visibility within features such as AI Overviews and AI Mode. This information remains connected with overall Search performance while also offering a separate view for generative AI visibility.
When this section appears in a report, consider:
- Which pages appear in generative AI results
- Whether impressions and clicks are increasing
- Which content types receive visibility
- Whether AI visibility supports qualified traffic
- How the trend compares with traditional search performance
Do not treat AI visibility as an isolated score. It should still connect with website visits, engagement, brand discovery, leads, sales, or another measurable objective.
A Five-Minute SEO Report Checklist
Use this process each time you receive a report:
- Confirm the dates, comparison period, and data sources.
- Check conversions, leads, sales, or other primary outcomes.
- Review the organic traffic trend and top landing pages.
- Examine Search Console clicks and impressions.
- Identify the most important page and query gains or losses.
- Check whether critical pages are indexed.
- Review serious technical and Core Web Vitals issues.
- Evaluate backlink relevance rather than raw quantity.
- Separate completed tasks from achieved results.
- Confirm that the report provides explanations and next actions.
If the report exposes serious visibility or technical problems, start with a free SEO audit to identify the highest-priority issues.
For ongoing implementation and measurement, professional SEO services can connect the report’s findings with a practical improvement plan.